Monitoring
A SynQt system is several processes on several machines, joined by links a browser cannot see. When something goes wrong, you usually want to know what a click did, not what one log file says. Monitoring answers that: one click becomes one trace, running through every entity it touched.
Monitoring is off until you add a monitor. Until then nothing is recorded or stored, and each instrumented call site costs one atomic read, measured at 0.23 ns (the baseline). Turning it on or raising its level needs no rebuild.
Adding one
This writes four things, because any three without the fourth leave something broken or unsafe:
- the monitor entity, which keeps the history and serves the console on its own port;
- a console client, marked
console: true, delivered only to an operator; - the sign-in gate, a static page an anonymous visitor gets instead of the console;
monitoring.entity, the one line that makes every service report.
You can also draw it: synqt design has a monitor on its palette. Dropping one and
applying runs the same scaffolder, and the change set lists all four files before writing
anything. The designer on this site writes the same four files: its
templates are published from the scaffolder that owns them (tools/gen-design-assets.py,
checked by tools/synqt/tests/test_monitoring.py), not kept as a second copy that could
drift. Both copies draw a monitor only together with its console.
A monitor consumes no connect point, in the editor or in synqt.yaml. Entities report
to a monitor and it reaches none of them, so nothing would ever open such a link. It would
also put application data into a store meant to record what happened, not the data
itself.
monitoring.entity is one line, so it is easy to forget. A type: monitor entity
that nothing names still builds, starts and serves a console with an empty history, so
synqt check warns about it, and about a second monitor beside a wired one.
Then create your login:
It prints an entry for the monitor's .env. Like every credential in SynQt, it lives in
the entity's environment, never in synqt.yaml.
With no operator configured, the console refuses everybody and says so at startup, so an empty console is not mistaken for a broken deployment.
What is recorded
Every event is a record, not a sentence. It carries the time, the entity, the severity, the category, its trace, its duration if it ended a span, and a map of attributes. The message is for people and carries no fact that is not also an attribute, so filtering and searching never mean hunting for substrings.
There are six categories, a fixed set, so a filter list does not depend on what happened to be logged today:
| Category | What lands in it |
|---|---|
lifecycle |
an entity or a link starting, stopping, reconnecting |
transport |
an upgrade, a mesh handshake, a socket closing |
authorization |
a refusal, a scope check, a session elevation |
call |
a slot crossing a link |
data |
a model publish, a property push, a provider query |
application |
whatever an entity's QML says through Log |
There are six severities, trace to fatal, following OpenTelemetry.
How one click becomes one trace
A trace is one story, and a span is one piece of work in it. SynQt opens a span for each slot call that crosses a link. A click that reaches the edge, which calls a service, which calls another, is one trace with a span per hop, each the child of the one before.
The identifiers travel with the session, which already goes down the chain, so no second channel exists to forget. They stay separate from the session, and a trace identifier authorizes nothing. In detail:
- A trace starts at the browser's call. A visitor cannot choose a trace. The edge opens
the first span itself and ignores any
traceparentin the request, as it ignores a session the client claims, because a value the visitor controls could splice their call into someone else's story. - An outbound call carries the span of the current work, not the span that reached it, so the service's work is a child of the edge's, not a sibling.
- Everything the entity logs while answering joins the span.
Log.infoin a slot, a provider's query, a refusal by a scope gate inside a call all belong to the call, so a trace shows what happened, not only who called whom. - A wait keeps its trace to itself. The identity routes wait for an answer in a bounded nested event loop that keeps serving requests, so calls arriving during the wait belong to other people. Each wait detaches for its duration, and those calls start their own traces. A slot never waits this way.
- A continuation still belongs to the click. In
Store.recent().then(rows => Cache.put(rows)), the second call runs later, after the slot has finished, and carries the first call's trace. The session does not follow it: by then the entity acts on its own behalf, which is a separate authorization question. - Incoming identifiers are accepted only in the shape SynQt creates: 32 and 16 lower case hex characters, checked on the mesh, where the peer is authenticated by certificate, and again when a record reaches the monitor. Anything else is dropped, and the call starts its own trace. Every downstream entity repeats an identifier and the history stores it, so its shape, not trust, bounds what a peer can put there.
A service reached by two clicks answers both on one link with one Caller. Each call continues the trace it arrived with, so the second is never filed under the first.
Tracing stays on when you lower call. A span opens for every call the category lets
through at all, including ordinary calls that monitoring.levels.call: warning then
declines to record, because what hangs off that span happens while the call runs: the
outbound call carries it, and a refusal two entities later names it as parent. Deciding
at the end of a call whether it deserved a span would leave every chain without its first
span, and the refusals an operator kept by lowering the level would have no story behind
them. Setting a category to off costs nothing and records nothing.
What is not recorded, and why
No credential, ever. The record names a session by a handle (half of its SHA-256),
never by the value a browser sends. It records an upgrade as a decision and a reason,
never the request itself. A provider password, an OAuth token and an Authorization
header never reach the pipeline.
The call sites guarantee this, and the pipeline adds a backstop for the one place an
application decides what a record carries. Every event passes through one function on its
way to the ring buffer, which records as [redacted] any attribute whose name names a
credential (password, passphrase, secret, token, authorization, cookie,
credential, bearer, and apikey or privatekey written whole or with _ or -,
matched anywhere in the name, in any case). It keeps the name, so the record shows a
value was withheld. So Log.warn("refused", { authorization: header }) does not put a
bearer token in the console. It reads names, never values, because a filter that guesses
what a secret looks like will miss and still look like a guarantee; and it never touches
the message, which is prose you wrote and search on. Keep credentials out of what you
pass it, as with any log; the backstop catches what slips through.
No call arguments unless the member asks. A recorded call carries its shape: which
member, whether a person or an entity called, how many arguments, how long it took, and
which check refused it. It does not carry the arguments, because they are what somebody
typed. To keep a member's values, mark it with
capture.
No identity fields in a capture. synqt check refuses capture on a member whose
arguments carry sub, email or login, directly or inside a record. That would make
the operations record a second copy of the identity store: kept longer than a session,
read by people it is not about, and exported wherever an operator sends it. Write
monitoring: {capture_identity: acknowledged} if you want it anyway.
Nothing a browser claims. A client never reports events. It cannot reach the mesh, and a browser reporting as an entity would put a value a visitor controls where an authenticated entity name belongs, the exact confusion SynQt's two identity systems prevent. A visitor's actions reach the record through the edge that served them, as facts the edge observed.
Turning it up
monitoring.levels sets the lowest severity each category records. It is read at startup
from the resolved topology, so raising call during an incident takes a configuration
change and a restart, not a rebuild:
A category set to off records nothing at any severity. A category you do not name keeps
its default. synqt check refuses a category or level this build does not know, because a
misspelling would show up as an empty console, which looks like there is nothing to
find.
The three tiers
Hot, in memory. A bounded ring buffer in every entity, drained by one writer thread that batches by size or elapsed time. It never blocks the caller and never grows. Past the bound it drops the oldest event and counts it, and the count is itself an event, so a gap shows up.
Warm, on the monitor. SQLite with WAL, STRICT tables, one transaction per received batch, indexes on time and on (entity, category, time), and FTS5 for searching messages and attributes. The console reads it, and it is what you have when nothing else runs. It needs no second process to deploy or back up.
Retention needs no cron job: the monitor prunes on a timer, bounded by both age and total bytes:
Cold, elsewhere, off by default. See the next section.
Exporting to what you already run
If your team already runs an OpenTelemetry collector, Grafana, Loki, Jaeger or a hosted backend, SynQt sends the same events there, and you keep your dashboards:
  - name: ops
    type: monitor
    export:
      otlp:
        endpoint: http://127.0.0.1:4318
      jsonl:
        path: build/ops/state/events.jsonl
        max_bytes: 67108864
        keep: 5
otlp is OTLP over HTTP with JSON encoding, which every collector accepts, with no
protobuf dependency and no extra license. endpoint is the collector's base URL without a
signal path; SynQt appends /v1/logs and /v1/traces. Each entity becomes an OpenTelemetry
resource with a service.name, so it arrives as a service with no mapping to write, and a
call that closed a span arrives as a span with its parent link intact.
jsonl writes one JSON object per line, which Promtail, Vector, Filebeat and Fluent Bit
all tail without a custom parser. The file is capped and rotated, because a monitor that
fills its own machine's disk becomes the outage.
If the collector needs an API key, put it in the monitor's environment; no configuration key can hold it:
One Key: value per line.
Two rules hold whatever the collector:
- Export happens after the history is written, so a collector that is down costs the monitor no record and no time.
- Every queue has a bound. Past
max_in_flightrequests, a batch is dropped and counted, because an exporter buffering for a collector that stopped answering is how a monitoring tool takes down the machine it watches.
endpoint must be https, or http to this machine. A batch holds the whole record of what
the system did: who called which member, which upgrades were refused and why, which peers
connected. The request also carries the API key above. Sending it over plaintext http to
another host would put the system's security record, and the collector's credential, on
the network in the clear, so the exporter refuses such an endpoint, once, at startup. A
collector on localhost or in the same pod is the normal setup and is allowed, since that
traffic never reaches a network. synqt check reports the same rule before anything runs,
and synqt build --release refuses it.
The console
The console is a separate client, built and delivered separately, reading a contract whose types are all strings, numbers or bools. It is independent of the topology it watches: adding an entity or renaming a connect point does not rebuild it, because a new entity is just another row on the ingest stream.
It shows what every entity is doing now, how many events arrived and how many were dropped, which entities are live and which have gone quiet, a filter by entity and severity, a search across messages and attributes, and any trace end to end.
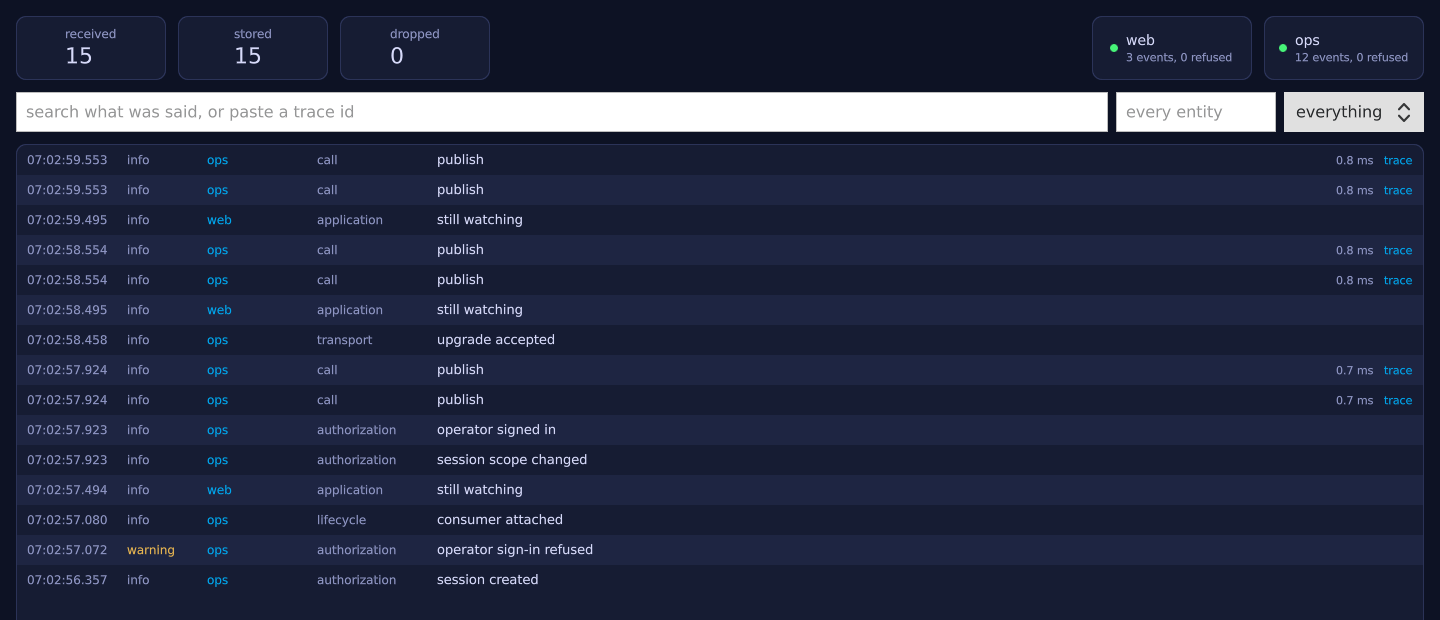
This is a real console. Two entities report: ops, the monitor watching itself, and
web, the edge, reporting over the mesh. Each tile shows an event count and a liveness
dot. The counters above separate what arrived, what was stored and what was dropped. The
table below is the record: timestamp, severity, entity, category, message, call duration,
and a link that opens the whole trace. tests/monitor-console takes this screenshot right
after driving the console in a browser, so it comes from a passing test run, not a stale
paste.
Liveness comes from the link itself. An entity that stops sending heartbeats shows as down, so a crash of the main application appears as a red tile, not as silence.
One query returns at most two thousand rows, whatever it asks for. The console sends a row count and the store decides how many to return, because every row is built in memory and serialized over the link, so an unbounded count would load the whole history at once. Two thousand rows is more than anyone reads on a screen; if it is not enough, narrow the query. Everything else on this path is bounded too: the ring buffer, the batch, the spool and the retention sweep each have a ceiling.
Severity and category cross the ingest link as numbers. A number this build does not know
is read as info and lifecycle. Otherwise an event with an unknown category would be
stored but would match no category filter and no severity floor, so nobody could find it.
An entity built against a newer vocabulary reports something readable instead.
Reaching it
The monitor binds 127.0.0.1 by default, and synqt check refuses any other host. To
reach the console, reach the machine first: through a VPN, an SSH tunnel, or on the host.
The console shows every request the system served and every refusal, behind one password
and no second factor, so do not expose it by copying an edge's public: block.
A deployment behind its own authenticating proxy is legitimate, and SynQt allows it, but only explicitly:
Off loopback, the operator password crosses the network, so a release build also needs
the console to be TLS: a tls: block with cert_file and key_file on the monitor, or
public.tls_terminated_upstream: true when the proxy terminates it. synqt check
--release refuses anything else.
Two gates apply either way. The bundle is delivered through
bundles:, so an anonymous caller gets the sign-in page and
cannot address the console bundle at all: it is a 404, not a 403. Signing in raises the same
session to the operator scope, which makes the console fetchable and unlocks its connect
point.
That map is the whole delivery gate, so synqt check verifies it. It refuses a
console: true client mapped to any scope other than operator, on the monitor or on an
application edge, and a monitor whose default scope resolves to any client. The second is
what a monitor without a bundles: block would fall back to: the project's first client,
which the generated main serves on that port. operator sits outside your project's
scope vocabulary, because an operator is not a user of your application, and a shared scope would
let one login reach the other's surface.
The identity it uses
The monitor has its own identity, separate from the application's. Credentials are
PBKDF2-SHA256 with at least 600,000 iterations, read from SYNQT_MONITOR_OPERATORS in the
monitor's environment. A credential with fewer iterations is refused at load, not accepted
with a warning; one malformed entry does not lock everyone else out; and an empty store
refuses everybody instead of allowing all.
synqt monitor operator add <name> creates an entry, and the CLI offers nothing else: the
list lives in the deployment's environment, and a CLI that edited it would be editing a
running deployment's secrets.
The sign-in route allows ten attempts a minute per client address, counted before the
password is read. Behind a proxy, name the proxy in public.trusted_proxies, as for any
entity that faces browsers. Otherwise every operator arrives from the proxy and shares one
budget, and ten wrong guesses from anywhere would lock everyone out with 429.
When the monitor is down
An entity whose monitor is unreachable keeps running normally and adds a spool file: it writes the batches it could not deliver to a bounded file in its own build directory, and replays them when the monitor returns. Past the cap, the oldest batches are dropped and the newest kept, and the monitor learns how many were dropped when it returns, so the gap shows.
Unreachable covers both kinds of outage: a monitor that was not there when the entity started, and one that disappears under a live link. The second is the common one (a restart, a redeploy), and it looks different on the wire: the entity's Replica stays in place, marked suspect, and QtRemoteObjects silently drops calls on it. The entity treats that state as "no monitor" and spools from the moment the link drops, so the record has no hole between the outage and the reconnect.
Testing what an entity says
Log.info("bid accepted", { amount: amount }) describes how an entity behaves, so you can
test it like any other behavior: the QML harness returns the events. See
asserting on what an entity said.
Configuration reference
The monitoring: block, at the top level of synqt.yaml:
| Key | Meaning |
|---|---|
entity |
the name of the type: monitor entity every service reports to |
levels |
the lowest severity each category records, and a category may be off |
capture_identity |
acknowledged to allow capture on a member carrying an identity |
public |
acknowledged to allow the monitor to bind a non-loopback host |
On the monitor entity itself:
| Key | Meaning |
|---|---|
public |
host and port the console is served on, loopback by default, and origin when a proxy puts it at another address |
tls |
cert_file and key_file the console is served with, as on a web edge |
retention |
max_age_days and max_bytes, both applied on a timer |
export |
otlp and jsonl, both off unless written |
bundles |
what each scope may download; written by the scaffold |
On the console client: console: true, and edge: naming the monitor that serves it,
which the designer reads to draw that link. synqt check refuses an edge: naming any
other entity, and one on an entity that is not a console client.