Benchmarks
SynQt's core is a live data path over a transport the Qt for WebAssembly documentation calls unsupported, so its speed and scaling are measured, not assumed. This page explains each measurement: what the number is, what it describes, and where it stops applying.
Every figure comes from a committed baseline under
benchmarks/results/, and
every harness behind one is a script you can run.
benchmarks/README.md
covers the same material for people changing the framework: the methodology, the defects
each harness found, and the exact numbers this page rounds.
One machine
The absolute figures describe one workstation: 32 cores, Arch Linux x86_64, Qt 6.12.0, everything on loopback. Read them for their shape and ratios, which hold across machines. They promise nothing about a host you have not measured. Every harness writes a file keyed by hostname, so to get numbers for your deployment, run it there.
The client-to-edge link
This is the browser's path: QtRemoteObjects framed over a WebSocket, through the same
WebSocketTransport adapter the client links. The harness runs the whole path in one
process, so these are lower bounds that a real network adds to.
| What | p50 | p99 |
|---|---|---|
| Returning slot, round trip, 64 B | 15 us | 26 us |
| Returning slot, round trip, 4 KiB | 18 us | 26 us |
| Property push, owner to consumer | 10 us | 14 us |
| Signal, owner to consumer | 10 us | 12 us |
| Pipelined slot calls | 282 000 calls/s |
Three results stand out:
- A one way push costs about two thirds of a round trip, as expected when framing dominates the cost.
- The round trip barely changes from 64 bytes to 4 KiB, so at typical payload sizes a call costs what the protocol costs.
- Throughput is over four times
1 / RTT, because calls pipeline: a client that makes ten slot calls in one frame does not wait for the first to return.
Replicating a whole model costs what moving its rows costs: 0.03 ms for one row, 0.27 ms for a hundred, 36 ms for ten thousand. Before publishing ten thousand rows at once, read the fan-out section below.
The edge's HTTP side
A web edge also serves ordinary requests: the bundle, the login routes, and any plain
HTTP an application adds. That path is QHttpServer in front of an in-memory SQLite
database (so storage is left out) with the persistence provider's busy timeout. The six
TechEmpower test types measure it. plaintext
and json compare directly with other web frameworks; the database rows do not, because
TechEmpower runs them against a database server over the network. At 256 concurrent
keep-alive connections:
| Test type | Requests/s | p50 | p99 |
|---|---|---|---|
plaintext |
37 633 | 6.7 ms | 9.8 ms |
json |
39 254 | 6.4 ms | 7.9 ms |
| single query | 38 012 | 6.6 ms | 13.0 ms |
| 20 queries | 20 770 | 12.3 ms | 17.8 ms |
| 20 updates | 13 924 | 18.2 ms | 20.6 ms |
fortunes |
38 541 | 6.3 ms | 12.9 ms |
The mesh
Every link between two service entities uses mutual TLS by default, even on one host, where it binds to loopback. A local socket is an explicit opt in, and this is why it exists:
| mutual TLS on loopback | local socket | |
|---|---|---|
| Slot round trip, 64 B | 18 us | 11 us |
| Property push | 11 us | 6 us |
| Pipelined throughput | 356 000 calls/s | 476 000 calls/s |
| Connection setup | 3.6 ms | 0.03 ms |
Once a link is up, mutual TLS costs 1.3x to 2x on operations measured in microseconds,
which is negligible for a long lived mesh link. The big difference is the handshake, about
130x, but a mesh link is set up once and then kept. So the default is the encrypted,
mutually authenticated link, and transport: local pays off only for short lived or very
numerous links. SynQt never chooses it implicitly, because it saves setup time by giving
up caller identity authenticated by certificate.
Fan-out: what one change costs when many are watching
An owner publishing to N consumers is SynQt's core workload, and it exposes the cost per consumer. The measurement sweeps three setups of the same arena: one shared world; one Source per session publishing everything; and one Source per session publishing only the k = 16 entities that session can see.
| Consumers | one Source per session, whole world | the same, interest-managed |
|---|---|---|
| 25 | 0.69 ms | 0.46 ms |
| 50 | 2.93 ms | 0.97 ms |
| 100 | 11.8 ms | 2.47 ms |
The left column is quadratic: each of N sessions rebuilds a slice of all N entities, so ten times the players means about ninety times the work. The right column is linear: capping each slice keeps the payload per session flat, and only the number of sessions grows. At a hundred players that is 4.8x less publish CPU and 6.25x less payload; against a 30 Hz tick, publishing takes 7% of each tick instead of a third.
Interest management is application code (the arena writes its own), and these numbers show it pays off.
End to end, under load
The whole arena, with every player a real node on the real transport:
| Players | Rows each, per tick | Publish CPU | Tick jitter | Snapshots delivered | Memory |
|---|---|---|---|---|---|
| 10 | 10 | 0.13 ms | 0.01 ms | 30.0 Hz | 78 MB |
| 50 | 16 | 0.94 ms | 0.01 ms | 30.0 Hz | 78 MB |
| 100 | 16 | 1.95 ms | 0.01 ms | 30.0 Hz | 79 MB |
| 200 | 16 | 4.28 ms | 0.01 ms | 30.0 Hz | 80 MB |
For this workload, one edge process tops out between 300 and 400 players, measured past the end of the committed sweep. At 300 the loop still holds 30 Hz, using 7.0 ms of each 33 ms tick. At 400 it does not: 9.0 ms of publish CPU, more than a second of median tick jitter, and 8 Hz delivered. Every player stays connected and nothing fails; the simulation runs slower than its rate, which is how a fixed rate authoritative server degrades.
That limit is per process. Two keys raise it:
threads: moves the delivery part of
the publish CPU off the loop, and replicas:
runs more processes. Neither splits the simulation itself, which is one world on one
thread by design.
Against other stacks
Measuring SynQt against itself catches regressions, but says nothing about whether it is fast. So the same workload (one publisher, N subscribers, 30 Hz, a 256 byte payload) runs against the stacks people compare it with, every column in one session on one machine. Propagation p50, in milliseconds:
| Subscribers | SynQt | bare Qt | Go | Rust | Phoenix | SignalR | bare Node | Socket.IO | Next.js (SSE) |
|---|---|---|---|---|---|---|---|---|---|
| 10 | 0.115 | 0.098 | 0.072 | 0.062 | 0.146 | 0.102 | 0.164 | 0.362 | 0.277 |
| 50 | 0.467 | 0.422 | 0.183 | 0.195 | 0.227 | 0.205 | 0.509 | 1.069 | 0.765 |
| 100 | 0.873 | 0.721 | 0.302 | 0.308 | 0.285 | 0.276 | 0.861 | 1.778 | 1.278 |
| 250 | 1.992 | 1.639 | 0.646 | 0.742 | 0.519 | 0.437 | 2.022 | 4.072 | 2.911 |
SynQt has a low fixed cost and a higher cost per subscriber. At ten subscribers it ranks fifth of the sixteen columns in the full table. At two hundred and fifty it ranks seventh, behind SignalR, Phoenix, both compiled baselines, its own bare Qt control and bare Node 26, and level with bare Node 24. Each added subscriber costs it more than it costs a BEAM node or a SignalR hub, so Phoenix passes it between 10 and 50 subscribers, and bare Node draws level between 50 and 100. Eight consecutive runs of that last cell gave between 1.88 and 2.00 ms.
Memory agrees. One more connection costs SynQt 63 KiB, against 34 for Go, 159 for Phoenix and 238 for SignalR: holding a connection is cheap, fanning out to it is relatively expensive.
Against what teams actually deploy, rather than bare baselines, SynQt does better: it beats Socket.IO on every row of the full table, and Next.js on both latency and CPU at every size in this sweep.
benchmarks/vs-frameworks/README.md
has the full analysis, including what the remaining cost per subscriber consists of and
which parts come from Qt. It also describes two measurement bugs the harness had and later
found, both of which produced plausible tables, so you can check its claims.
More cores
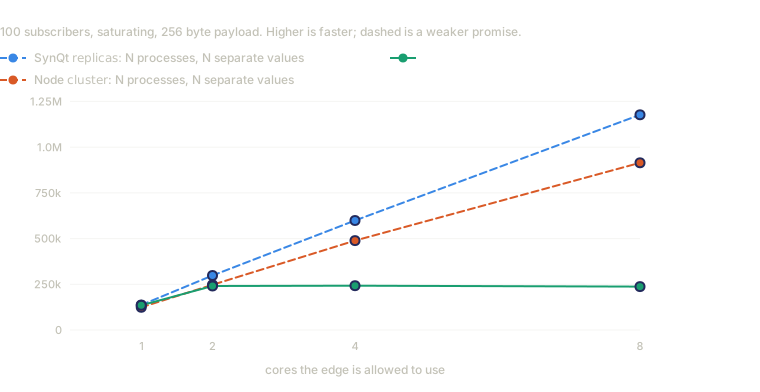
Both scaling keys were swept on the same workload, one publisher and 100 subscribers, saturating.
| Cores | replicas: N |
Node cluster |
threads: N |
|---|---|---|---|
| 1 | 136 433 | 124 117 | 135 200 |
| 2 | 298 258 | 247 242 | 240 783 |
| 4 | 598 533 | 488 696 | 242 400 |
| 8 | 1 176 750 | 914 302 | 237 150 |
Processes scale almost linearly, about equally well for SynQt and Node, but they scale N separate systems. At eight processes there are eight publishers holding eight values, and delivering one value to every subscriber from all of them needs a broadcast between processes that these numbers do not include.
The solid line keeps one shared value, and it flattens at about two cores of delivery.
threads: spreads the cost of delivering what an owner publishes, not the cost of
computing it, because the Source still runs once, on the main thread.
The rest
Sessions. The request path has two operations: a credential lookup at every upgrade, and a scope check in every gated slot. Both stay in the tens of nanoseconds up to ten thousand live sessions. A lookup reaches about 145 ns at a hundred thousand, where the table no longer fits the CPU caches and the figure varies with whatever else the machine is doing, so every figure is the median of five fresh tables. Creating a session stays flat at about 1.2 microseconds, whatever the number of live sessions.
Persistence. Through the default SQLite provider, with WAL and the entity's busy
timeout, on an SSD: about 25 000 rows a second in autocommit, 462 000 in one transaction,
and a 4 us indexed point read. The provider commits a WAL database at
synchronous=NORMAL, so a commit does not wait for the disk; the sync happens at each
checkpoint. Each Db.exec from an entity's QML is its own commit, so the autocommit
figure is what an entity writing row by row gets. An entity set to synchronous: full
waits for the disk at every commit, about 5.7 ms here, which caps it near 177 rows a
second (see the relational type for what each level keeps through a power
cut). A second connection writing to the same file does not move the measured writer's
median. The property worth testing there is safety, not speed, so the harness sets it up:
a third connection holds the write lock for a second, during which the writer with
QSQLITE_BUSY_TIMEOUT waits and succeeds, while the one without it is refused at once.
The same workload runs through the pooled PostgreSQL provider, in plaintext and over
verified TLS, as a parity check: one transaction around many writes beats a commit per
write there too, and verified TLS costs about a quarter on a point read.
Monitoring. With nothing listening, a call site costs 0.23 ns: one relaxed atomic load and a comparison. That is why every build includes monitoring instead of compiling it in on request: an application without a monitor pays nothing measurable. With a monitor attached, a record costs about 60 ns, and a full ring buffer costs 40 ns and stays flat, so an entity under a burst loses events instead of falling over.
The client. The WebAssembly bundle for a small 2D scene is 5.9 MB over the wire with
Brotli single threaded, and 6.2 MB threaded, on Qt 6.12.0 and Emscripten 5.0.5; nearly all
of it is the .wasm. A finished application adds its own code: the multiplayer arena client
is 7.6 MB. A cold start, from navigation to the first rendered frame, takes about 1.2
seconds. The median frame holds 60 Hz up to about 800 moving, interpolated blobs, then drops;
slow frames start a little earlier (counting every frame, the p95 leaves the 16.7 ms floor
at 675). The threaded kit is no faster here: both agree within the noise at every size,
because the per-frame cost is QML bindings and scene graph work, which threads do not
split.
Build time. A synqt build with nothing to do takes 0.1 s. That number matters most:
a build system that silently recompiles everything passes every correctness test, and only
a clock catches it. Without the compiler cache, a clean service build takes 13 to 26 s, a
clean WebAssembly client 66 s, and an edited Main.qml 55 s, mostly the Emscripten link,
which every edit needs.
What keeps these honest
A committed number guards nothing until something checks it, and comparing digits for equality would fail on every machine. So the checks target the claims each baseline supports: interest management keeps the payload per session flat, creating a session is amortized O(1), the busy timeout waits out a held write lock, and calls pipeline instead of queuing. Each is a ratio, an ordering or an invariant, independent of CPU speed, and every push checks all of them.
A claim is asserted only where the committed baseline beats it by at least 2x; the rest is printed and diffed. This keeps the check stable on a shared runner, where a flaky performance check would soon be turned off.